mirror of
https://github.com/wg-easy/wg-easy.git
synced 2025-10-16 12:40:52 +08:00
* improve docs and formatting

* lint in ci

avoid using bundled prettier from vscode extension

* fix action, typos

* remove header

* remove unused deps
43 lines
1.4 KiB
Markdown
43 lines
1.4 KiB
Markdown
---
|
|
title: Prometheus
|
|
---
|
|
|
|
To monitor the WireGuard server, you can use [Prometheus](https://prometheus.io/) and [Grafana](https://grafana.com/). The container exposes a `/metrics/prometheus` endpoint that can be scraped by Prometheus.
|
|
|
|
## Enable Prometheus
|
|
|
|
To enable Prometheus metrics, go to Admin Panel > General and enable Prometheus.
|
|
|
|
You can optionally set a Bearer Password for the metrics endpoints. This is useful if you want to expose the metrics endpoint to the internet.
|
|
|
|
## Configure Prometheus
|
|
|
|
You need to add a scrape config to your Prometheus configuration file. Here is an example:
|
|
|
|
```yaml
|
|
scrape_configs:
|
|
- job_name: 'wg-easy'
|
|
scrape_interval: 30s
|
|
metrics_path: /metrics/prometheus
|
|
static_configs:
|
|
- targets:
|
|
- 'localhost:51821'
|
|
authorization:
|
|
type: Bearer
|
|
credentials: 'SuperSecurePassword'
|
|
```
|
|
|
|
## Grafana Dashboard
|
|
|
|
You can use the following Grafana dashboard to visualize the metrics:
|
|
|
|
[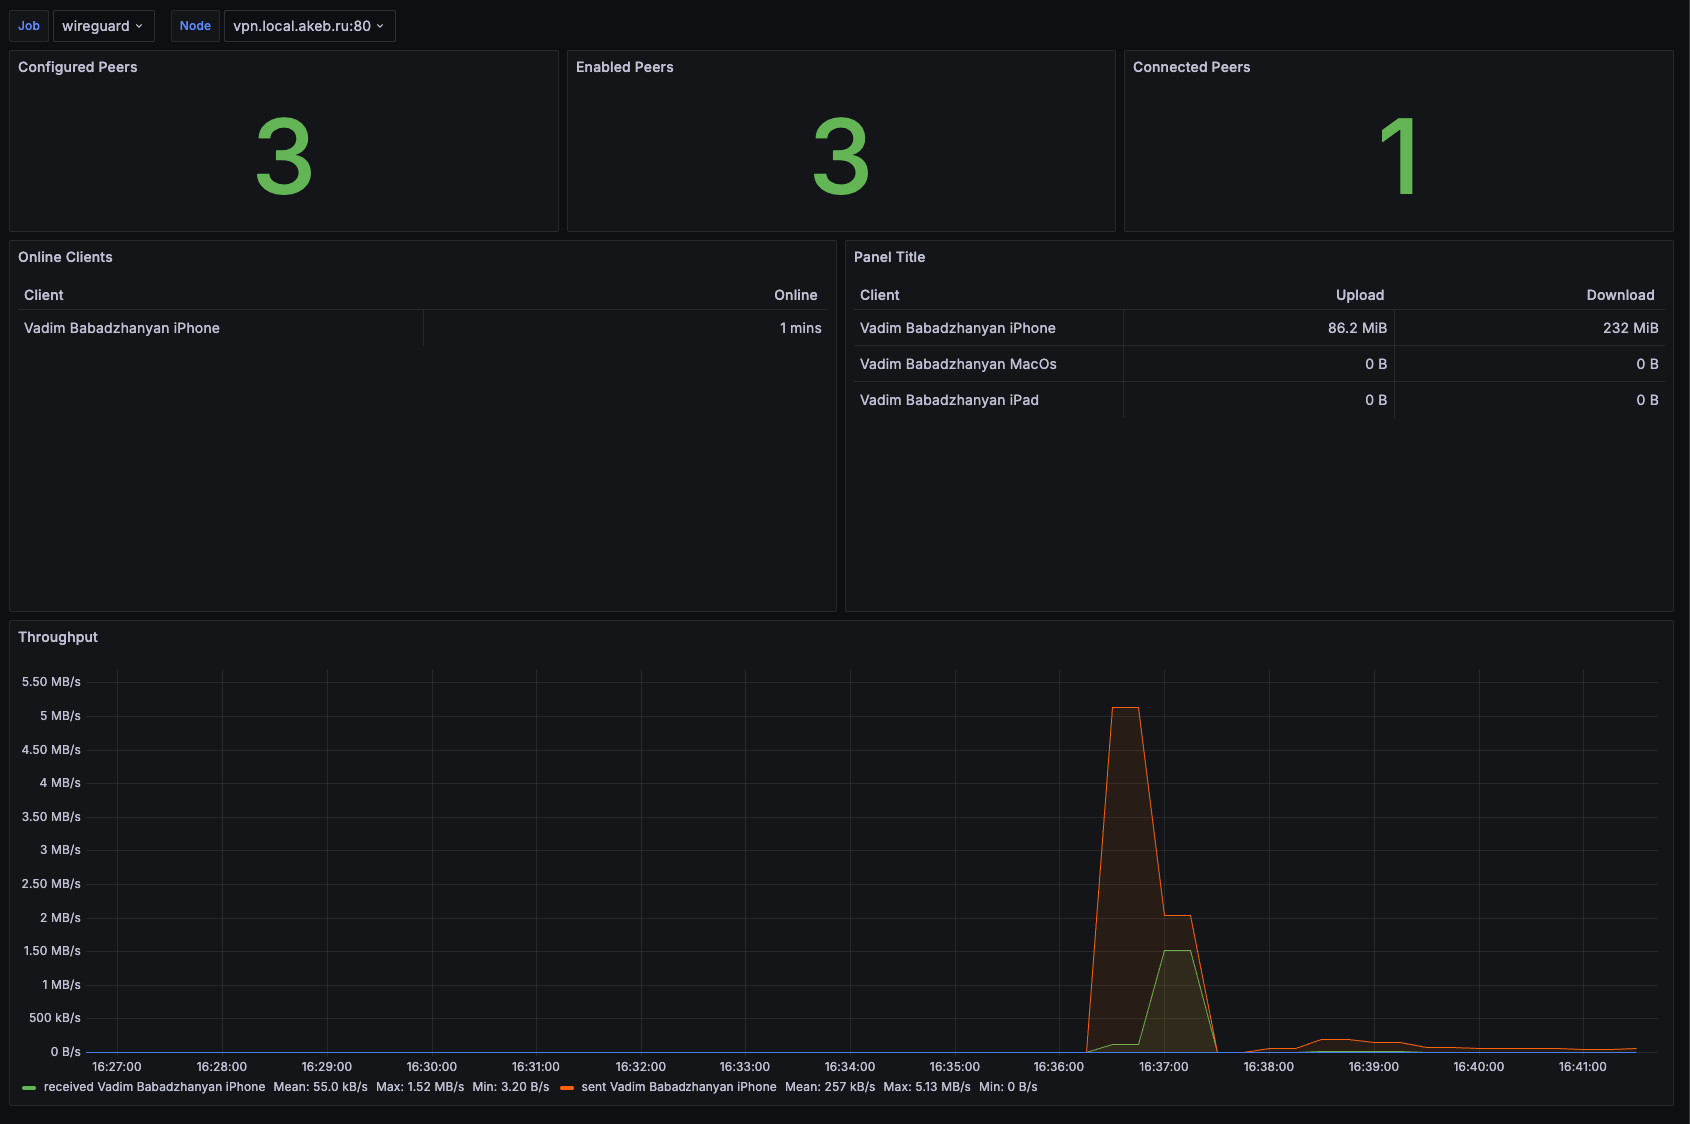](https://grafana.com/grafana/dashboards/21733-wireguard/)
|
|
|
|
[21733](https://grafana.com/grafana/dashboards/21733-wireguard/)
|
|
|
|
/// note | Unofficial
|
|
|
|
The Grafana dashboard is not official and is not maintained by the `wg-easy` team. If you have any issues with the dashboard, please contact the author of the dashboard.
|
|
See [#1299](https://github.com/wg-easy/wg-easy/pull/1299) for more information.
|
|
///
|